March Pinned Post
- Mar 1, 2023
- 7 min read

This month's pinned post is sponsored by Industry Scientific, North Queensland’s leading provider of instrumentation supply, service, repair, and calibration. https://www.industryscientific.com.au/
Welcome to the March pinned post. If you are new, this post has been around for several years now. The main focus is to walk through the process of analysing the past month, identifying the information that can help formulate a forecast for the month and breaking it down into a weekly summary. Many have helped support this page in the past, and this month it has been organised so that it's more than just the same few that are relied on to make this post available. The more support, the more I can devote time to collating more data for analysis. So thank you, because you are supporting this work.

February saw the second monsoon pulse arrive and produced several systems, including Cyclone Freddy. But in the immortal words of Freddie Mercury, who wants to live forever. The category five cyclone that reached 230km/h and 270km/h winds tried to but ran into Africa.

La Nina is in its third year, and while a 3-year La Nina is common, it is not very common. A four-year La Nina would be very rare. So how long will La Nina last? The significant models agree that La Nina is possibly in its last month. To determine this, we need to look at the influences on La Nina [1]. Those are:
Southern Oscillation Index SOI
Sea Surface Temperature SST

The SOI is the measure of the pressure difference between Darwin and Tahiti. When the numbers are positive and high, we expect more rainfall around Australia's top end.

The SOI is a critical piece of data, the reason is that there appears to be a link with Australia's Gross Domestic Product GDP. When we have rain, our GDP is healthy.
The SST is as it states for sea surface temperature. The region measured is along the equator between PNG and South America. When warmer towards Australia, we expect more rainfall in the top end of Australia.
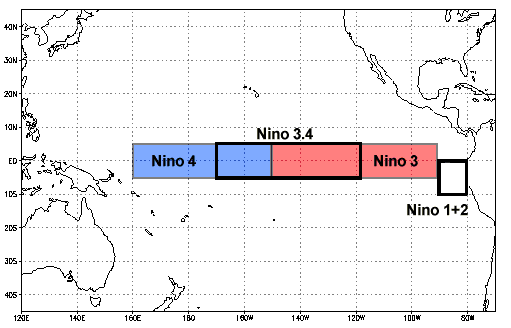
"A strongly and consistently positive SOI pattern (e.g. consistently above about +6 over a two month period)" [2] is what is required to be consistent with La Nina. For NINO3.4 the figure needs to be -0.4°C for La Niña for at least 6 consecutive months. [2]


The SOI is still showing signs of strength but the Nino3.4 is about to leave the desired zone. But there is one other factor that can impact on rainfall and that is the Indian Ocean Dipole which is the difference in Sea Surface Temps across the Indian Ocean.


The current IOD is in the negative phase which means increased rainfall for Australia. A negative IOD is where greater-than-average sea-surface temperatures and greater precipitation in the eastern Indian Ocean region. Currently we are neutral.

Rainfall for the previous month shows the top end achieving above-average rainfall, however, the West and East of Australia saw below-average rainfall, but probably just as well for NSW given the flooding. South Australia remains dry with no negative Indian Ocean Dipole. And also with no remnant cyclones that would sweep across WA into SA. With no lows moving down the coast of QLD, there has been less than average rain South of Ayr.
Looking ahead now
The chance of above-normal rainfall and temperatures for Australia are shown in the following maps from the BOM.


The above is what we can models of data to represent information in a way that we can more easily analyse. There are several models we can use to work out patterns ahead, they are never perfect and often surprises creep in that will throw things out by a week or more. However, forecasts are never perfect and if you expect them to be you will always be disappointed. We simply do not have everything we need to be able to map every molecule in the atmosphere. For me, I am at the mercy of the data produced and collected by others. However, having local knowledge can often give you the edge, and having more recent data can also give you the edge.
First week
Those that watch the Facebook posts note I stay around the 2 to 4-day forecast. Anything outside this starts to be in the realm of forecasts that can be ahead, behind, 100s of km out with location and more or less intense. In other words, the degree of error is extreme. So I used Windy, and we know from Windy that there are four models. I would also combine the BOM, which I would state based on my experience with the AMOS weather tipping competition, is far more accurate than the other models, particularly around daytime temperature, and to a lesser extent, rainfall.
Temperature


Temps decreasing towards the end of the first week in the East, but continuing to stay warm in the West.
Rainfall


For this week the rain sweeps East into the Gulf region across to the peninsula. Some of those more central and southern regions of QLD to see some possible rainfall.
Second week
To look into the second week, we can look at the longer-range models, however as mentioned before you need to consider the amount of error. I generally find the models have the main pressure systems too far East or West. To work out which way they are likely to be, you need to have watched the models over the full length. For GFS (tropicaltidbits.com) which is 16 days, you should watch from the 16 days. You will see the systems each day moving one way or the other. There are longer range models like the ECWMF 45 day (available on Meteologix.com) but I count those as mere speculation and based most likely on averages.
The GFS models over the last week or so have had a low popping out into the Coral Sea in the second week of March, however as we have progressed closer to that date, the models have the low heading back West, and in more recent days back East.


This back-and-forth movement will refine to a position where we can be confident, and that will be within about 4 days. What we can say is that the most likely day for heavy rainfall is around the 9th March. And we know the low will reform somewhere in the Gulf, possibly more West of where the current forecast is. The High to the South will most likely guide it to the West given the forecast position.

Third week
We can use the GFS model to get an idea of what to expect in the third week, but its only an indication. Location and intensity are normally exaggerated. And we can see a low approaching QLD. Low-pressure systems in my view normally follow rough patterns during a season, when you see one heading into the Coral Sea from the Gulf and out to New Caledonia as we have seen, we are likely to see this again, maybe several times and we have seen this. We have also seen on low head towards the QLD coast then down to NZ, Severe Tropical Cyclone Gabrielle. So with that in mind, while this low is purely speculation and mathematics, given past patterns this is entirely feasible. So we know that the low that moved West should draw some trail through convergence up the QLD coast before a possible low in Week 3. So reasonable fine weather apart from that convergence. In this model the convergence has reached the most North part of the peninsula.

Week 4 and 5
March has a few extra days in February, so this will go into the fifth week of March. To strengthen our view for the month we now need to rely on more pattern-type data. And the best data would be the Southern Oscillation Index SOI. This has a rough cycle of peaking in the positives during La Nina every 4 to 6 weeks.


The data shows the lowest point around the 2nd Feb and the next low point around the 24th. That's about a 3-week cycle. It could be the little dip is a slight anomaly in the cycle so the full cycle is yet to be seen. So give it another week and we are likely to see the lowest point. That is generally when the Trade winds kick in,low-pressure and the High pressure reaches up the coast. So while we don't see rain from low pressure activity, we see rain from trade winds. So trade wind rain in first week of April. Storm activity has generally ceased and won't start back up again, although we do have a 3rd monsoon pulse to come.
Another model that we can draw on is the Madden-Julian Oscillation MJO which records the most active position of the monsoon trough.

Currently showing it is in the center, which you might think is weak, but what it actually means is that its evenly spread across regions. And we can see the monsoon trough is still sitting over the top of Australia with Severe Tropical Cyclone Judy over Vanuatu shown by the dot dash line from the BOM synoptic.

The MJO shows that we have 3 to 5 weeks roughly before the next pulse, with roughly a week between each region. However this season the pulse has favoured our region and skipped others quickly. So closer to 3 than 5. That means the end of March into the first 2 weeks of April we may see the monsoon pick up again. Cyclones are more intense later in the season, but we have had very low cyclone activity around Australia. What we are more likely to see is the monsoon sit along the top end of Australia, and not a great deal more rain apart from the Far North tropical coast of QLD to Gulf region to Darwin. We should then see the change of season with some different systems coming through mid to end of April. But watch for lows heading towards QLD from Vanuatu, that would be the pattern I am yet to see repeated from TC Gabrielle.
References:

Comments